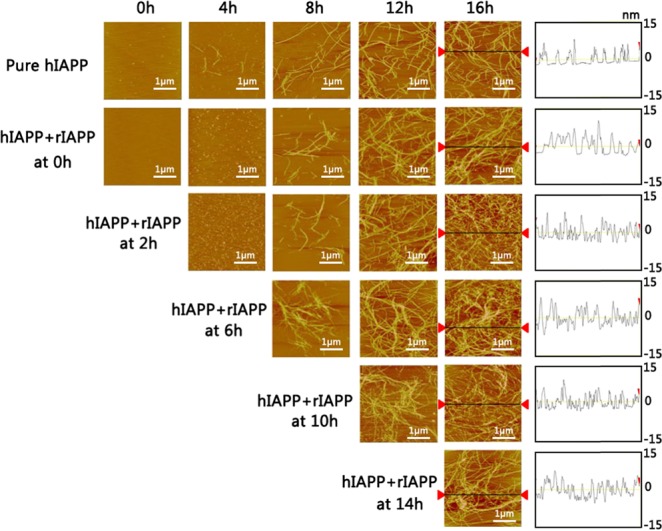
Figure 2.

AFM images for pure hIAPP (25 μM, the first row) and cross-seeding of hIAPP (25 μM)/rIAPP (25 μM) captured at different time points of 0, 4, 8, 12, and 16 h. The notation of “hIAPP + rIAPP at 0, 2, 6, 10, and 14 h” indicates the different time points to add freshly prepared rIAPP monomers to the seeded hIAPP solution. The height analysis for the final amyloid fibrils for each group is also provided.
