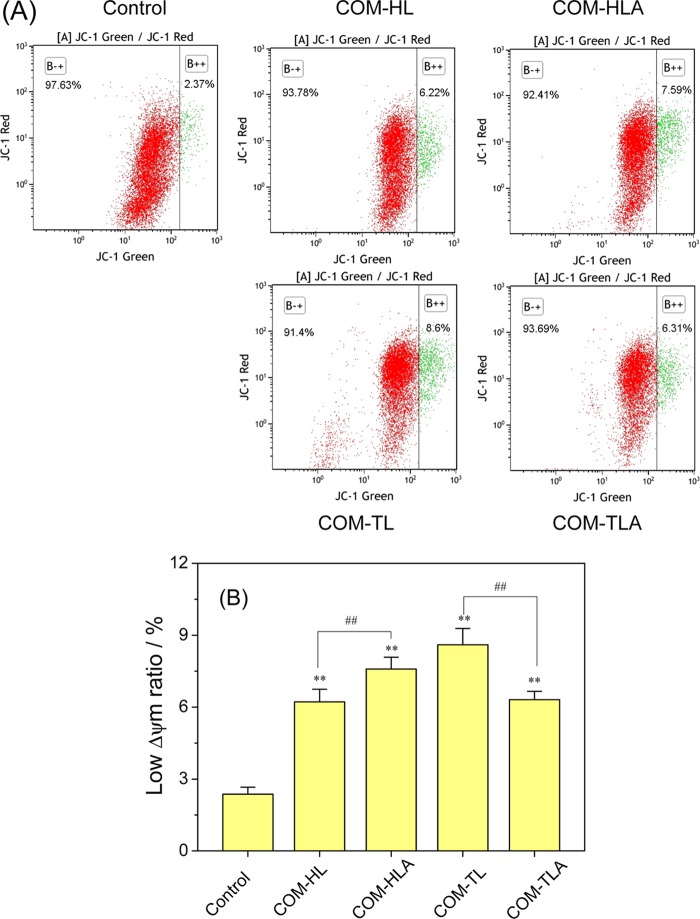
Figure 7.
Effect of varying shapes of COM crystals on mitochondrial membrane potential (Δψm) in HK-2 cells. (A) The dot plot of Δψm after incubation with varying shapes of COM crystals for 6 h; (B) quantitative histogram of Δψm. Crystal concentration: 400 μg/mL. Compared with control group, *p < 0.05, **p < 0.01. COM-HL treatment group vs COM-HLA treatment group, COM-TL treatment group vs COM-TLA treatment group, #p < 0.05, ##p < 0.01.

