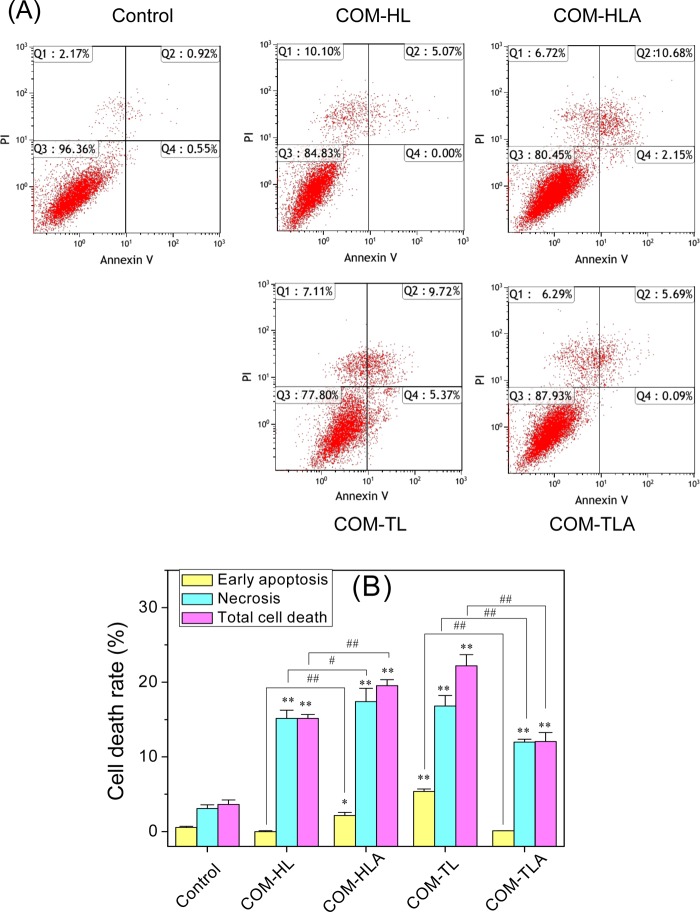
Figure 9.
Cell death of HK-2 cells after exposure to varying shapes of COM crystals for 12 h. (A) The representative dot plot of apoptosis and necrosis. Quadrants Q1, Q2, Q3, and Q4 denote the ratio of necrotic cells, late apoptotic cells, normal cells, and early-stage apoptotic cells, respectively. (B) Quantitative results of apoptosis and necrosis. Crystal concentration: 400 μg/mL. Compared with control group, *p < 0.05, **p < 0.01. COM-HL treatment group vs COM-HLA treatment group, COM-TL treatment group vs COM-TLA treatment group, #p < 0.05, ##p < 0.01.

