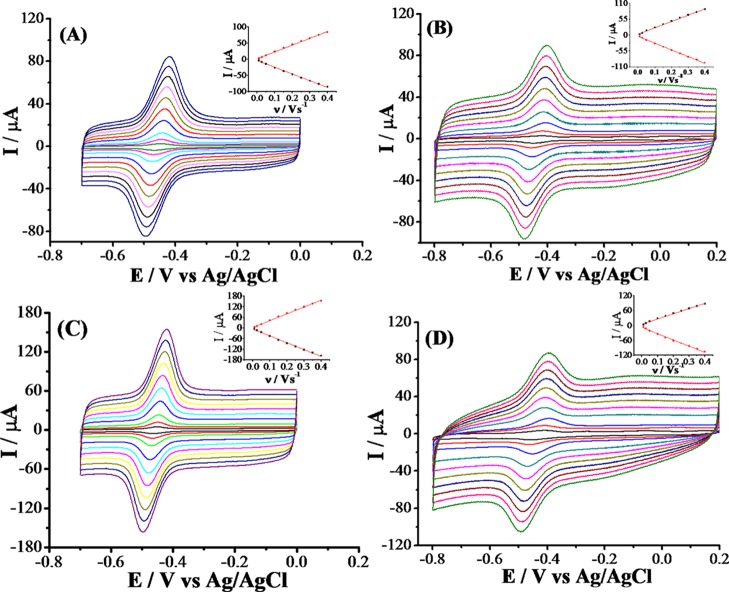
Figure 3.
CVs recorded at (A) GOX/CNT-1, (B) GOX/CNT-2, (C) GOX/CNT-3, and (D) GOX/CNT-4-modified GC electrodes in an N2-saturated 0.1 M PBS solution at different scan rates from inner to outer curves: 10, 25, 50, 100, 150, 200, 250, 300, 350, and 400 mV s–1. Inset shows the linear dependence of Ipa and Ipc on the scan rate.

