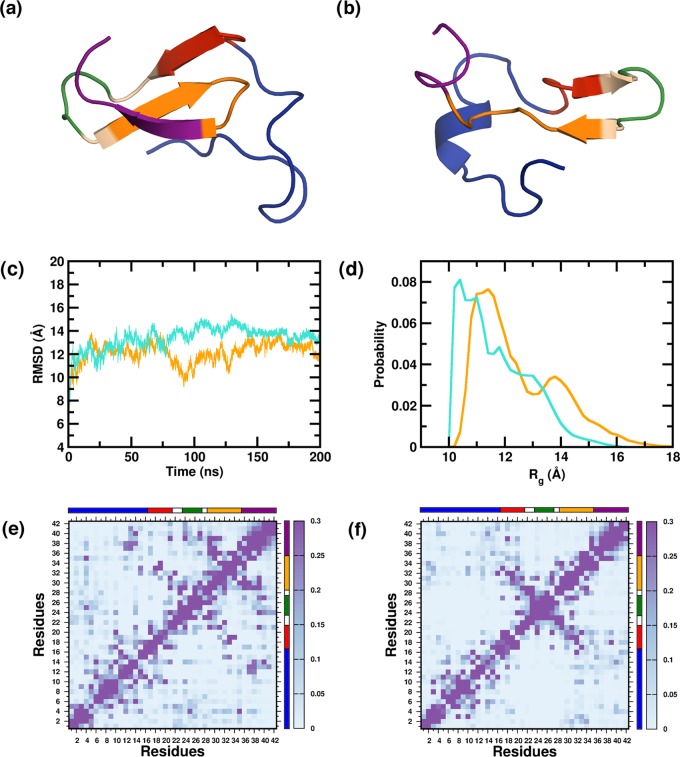
Figure 1.
Representative structure from the monomeric ensembles (a) PW-M and (b) PG-M. The peptides are colored segment-wise. (N-terminal region (NTR)—blue, central hydrophobic core (CHC)—red, turn region (TR)—green, second hydrophobic region (SHR)—orange, C-terminal region (CTR)—magenta.) (c) Time evolution of the backbone RMS deviations from the starting structure, averaged over multiple trajectories. (d) Distributions of the radius of gyration (Rg) of the PW-M and PG-M ensembles. Data for the PW-M and PG-M systems are shown in turquoise and orange, respectively. Intramonomer residue–residue contact probabilities for the (e) PW-M and (f) PG-M systems. Axes denote the residue numbers. The color scale for the contact probability is shown at the extreme right of each plot. The color bar at the top and right of each plot represents the segments in the Aβ peptide.

