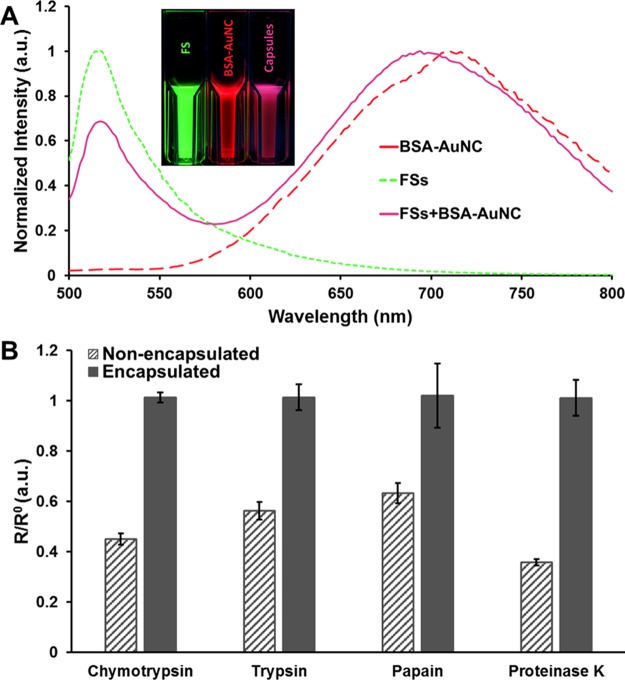
Figure 1.
(A) Normalized emission spectra of FSs (green dashed line), BSA-AuNC (red dashed line), and microcapsules containing both FSs and BSA-AuNC (pink line), (Inset) photographs of luminescent FSs, BSA-AuNC, and microcapsules containing both FSs and BSA-AuNC suspended in solution under UV illumination, (B) plots of R/R0 of nonencapsulated BSA-AuNC (dark gray stripe) and encapsulated BSA-AuNC (dark gray solid) in the presence of proteases. Here R and R0 represent BSA-AuNC luminescence intensities in the presence and absence of proteases respectively. Error bars represent 95% confidence intervals for three separate batches of sensors.

