
Figure 2.
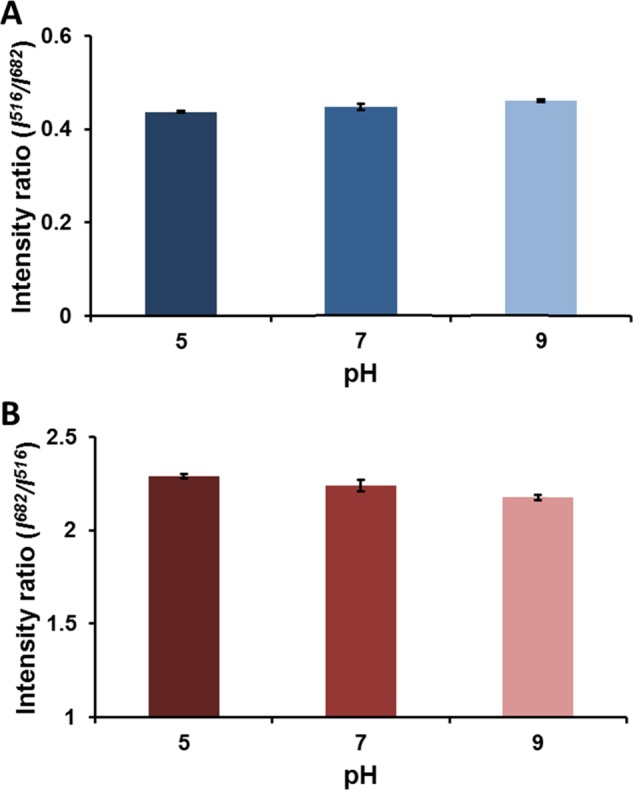
Ratiometric response of microcapsule sensors at different pH, normalized to (A) BSA-AuNC peak (682 nm) and (B) FSs peak (516 nm). Error bars represent 95% confidence intervals for three separate batches of microcapsule sensors.
Official websites use .gov
A
.gov website belongs to an official
government organization in the United States.
Secure .gov websites use HTTPS
A lock (
) or https:// means you've safely
connected to the .gov website. Share sensitive
information only on official, secure websites.
Ratiometric response of microcapsule sensors at different pH, normalized to (A) BSA-AuNC peak (682 nm) and (B) FSs peak (516 nm). Error bars represent 95% confidence intervals for three separate batches of microcapsule sensors.