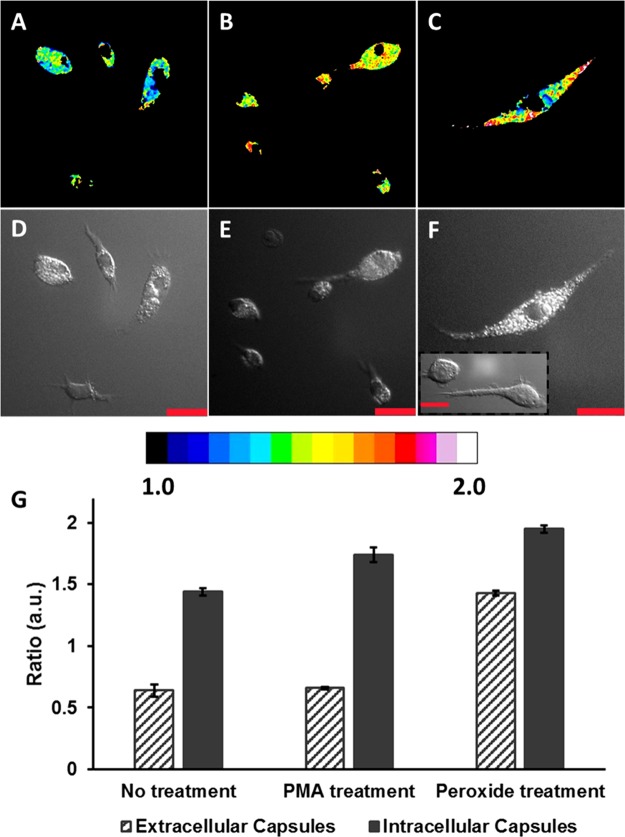
Figure 4.
Confocal fluorescence images of RAW 264.7 macrophage cells. The pseudocolored images represent the ratio of emission intensities collected using a 510–540 nm band-pass filter and a 633 nm long-pass filter, when excited at 445 nm. (A) Cells incubated with microcapsules for 1 h at 37 °C, (B) microcapsule-loaded cells after PMA (2 μg/mL) exposure for 30 min at 37 °C, and (C) microcapsule-loaded cells after H2O2 (500 μM) exposure for 30 min at 37 °C. (D–F) DIC images of the cells in (A)–(C), respectively. The scale bars correspond to 30 μm. (G) Ratiometric response of extracellular (dark gray stripes) and intracellular (dark gray solid) microcapsule sensors. The error bars represent 95% confidence intervals for three separate batches of microcapsule sensors.

