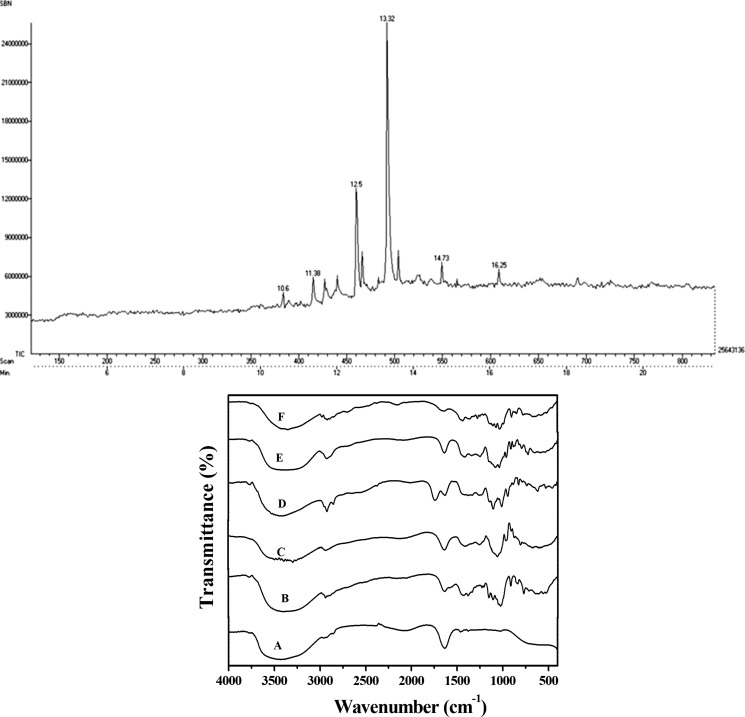
Figure 2.
(a) GC chromatogram of EPS obtained from Scenedesmus sp. SB1, indicating the retention time of different sugars. (b) FTIR spectrum of EPS from Scenedesmus sp. SB1 overlaid against standard sugars; A, EPS of the strain; B, glucose; C, maltose; D, polygalacturonic acid; E ribose; F, mannose.

