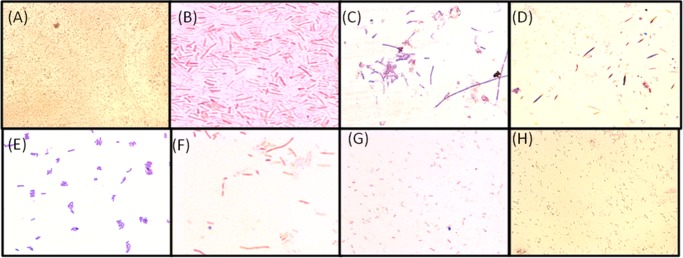
Figure 2.
Optical microscope images of E. coli cells following Gram staining: (A) control (40× resolution), (B) control (100× resolution), (C) treated with P(Ala-HEMA)14 within the zone of inhibition (100× resolution), (D) treated with P(Ala-HEMA)14 away from the zone of inhibition (100× resolution), (E) treated with P(Leu-HEMA)15 within the zone of inhibition (100× resolution), (F) treated with P(Leu-HEMA)15 away from the zone of inhibition (100× resolution), (G) treated with P(Phe-HEMA)10 within the zone of inhibition (100× resolution), and (H) treated with P(Phe-HEMA)10 away from the zone of inhibition (100× resolution). Polymer-treated bacterial cells appear to be stacked and CV color is retained in the vicinity of the zone of inhibition and the effect becomes less prominent with increasing distance from the inhibitory zone.

