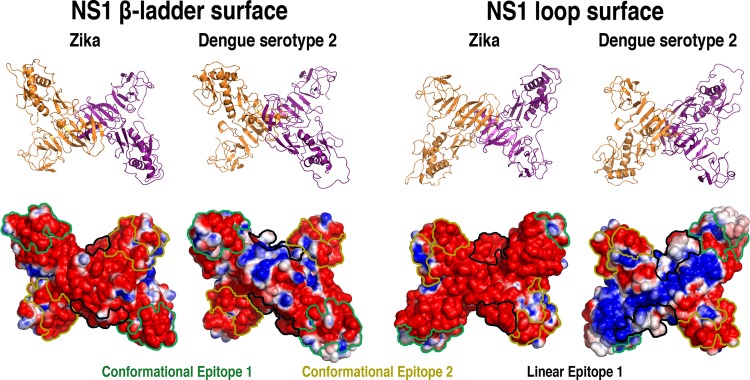
Figure 4.
Cartoon representations and electrostatic surface potential on both faces of glycosylated ZIKV and DENV2 NS1 proteins. The locations of the predicted epitopes are color-contoured (green: CE1, yellow: CE2, and black: LE1). Negatively charged regions are shown in red, positively charged regions in blue, and neutral regions in white. (Plotted potential ranged from −2 to +2 kJ mol–1 e–1.)

