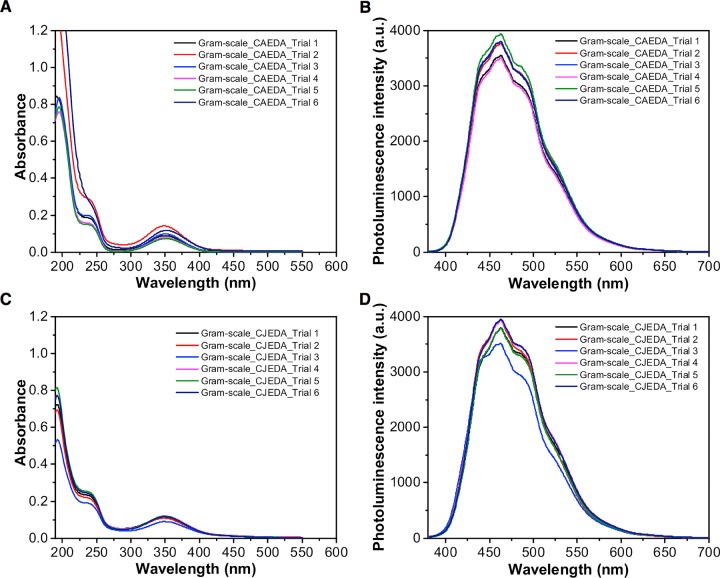
Figure 3.
Absorption and emission plots of gram-scale synthesis of six samples of CA-18 and CJ-14 CDs. CDs were synthesized using 100 mL starting volume in the presence of EDA. (A) UV absorption spectra of 1.21 × 10⁻⁵ g CA-18 CD/mL DI water from different trials. (B) Photoluminescence emission spectra of 1.2 mg CA-18 CD/mL DI water. (C) UV absorption spectra of 1.21 × 10⁻⁵ g CJ-14 CD/mL DI water from different trials. (D) Photoluminescence emission spectra of 1.2 mg CJ-14 CD/mL DI water. Samples were excited using a 355 nm laser (see Table S3).

