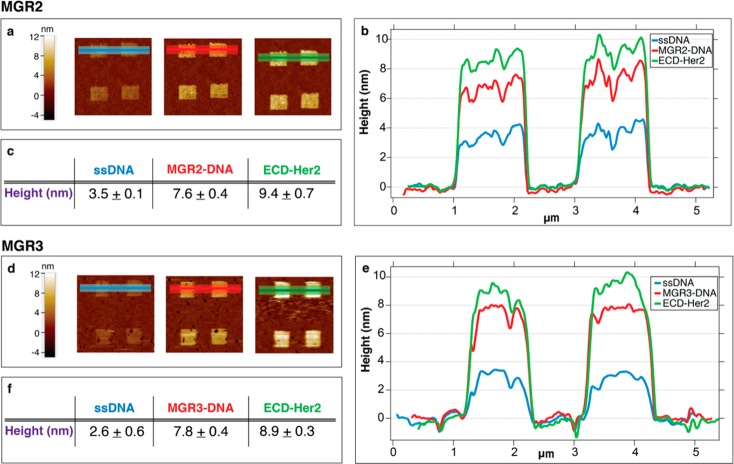
Figure 2.
ECD-Her2 nanoarray detection by MGR2 (A–C) and MGR3 (D–F) Abs. (A, D) AFM images across the nanopatches after DNA immobilization, antibody loading via DDI, and binding of the antigen. (B, E) Relative topographic line profiles from the AFM images in panels A and D (light blue, DNA nanografting; red, Ab-conjugate immobilization via DDI; green, 10 nM ECD-Her2 binding). (C, F) Mean and SD values of the patch heights measured from the line profiles across the nanopatches, which correspond to the colored areas in images A and D at each step of the experiment.

