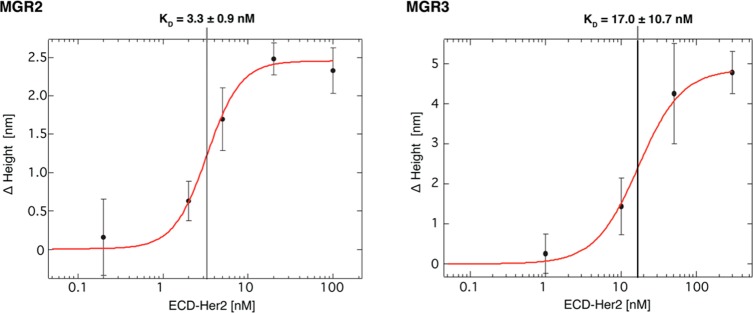
Figure 3.
ECD-Her2 binding curves for MGR2–DNA (left) and MGR3–DNA (right) conjugates immobilized on the nanoarray. Average values of the variation in height (Δh) detected on the nanopatches (n = 4) are plotted versus ECD-Her2 concentration. Data were analyzed using the Hill equation with sigmoidal fitting, and KD values were determined.

