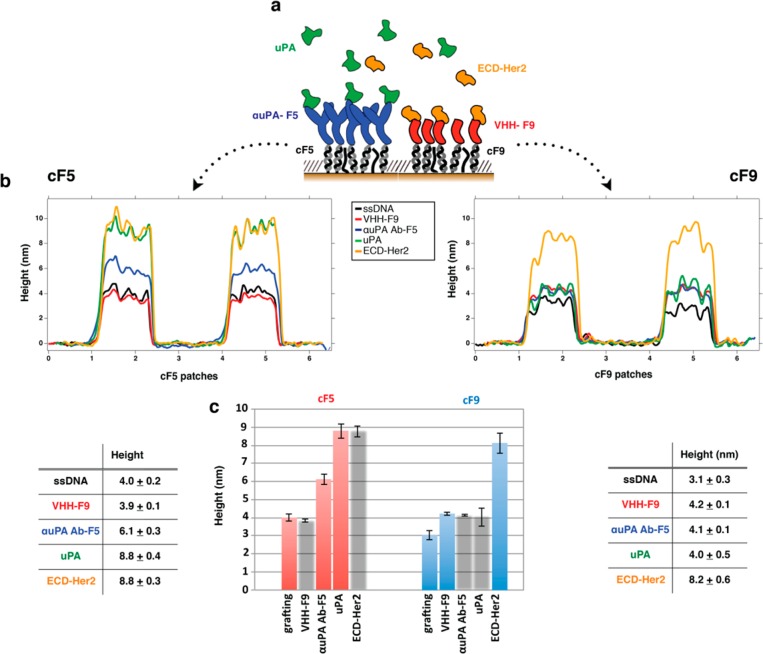
Figure 7.
Multiplex detection of two different biomarkers (ECD-Her2 and uPA) on the same surface. (A) Schematic of DDI immobilization of binders on the DNA-based biosensor and subsequent detection of the antigens. Height variations of the two separated sets of DNA nanopatch SAMs (cF5 and cF9) after each biomolecule incubation step (in the following sequential order: VHH EM1-F9 conjugate, αuPA Ab-F5; ECD-Her2 antigen, and uPA antigen) are visualized by topographic profiles (B) and histograms (C); mean and SD height values (n = 4) are reported in the tables. Columns where no binding was expected (and therefore no height increase) are gray.

