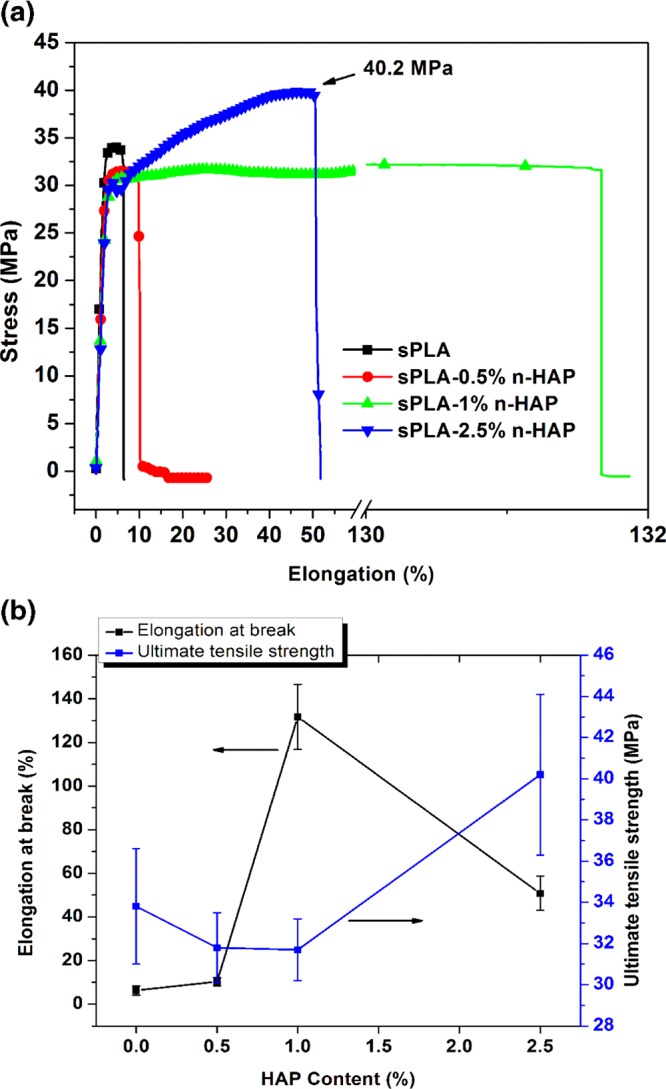
Figure 13.

(a) Representative data for stress of sPLA and sPLA/n-HAP biocomposites against elongation percentage at break. (b) UTS and elongation at break of sPLA and sPLA/n-HAP biocomposites.

(a) Representative data for stress of sPLA and sPLA/n-HAP biocomposites against elongation percentage at break. (b) UTS and elongation at break of sPLA and sPLA/n-HAP biocomposites.