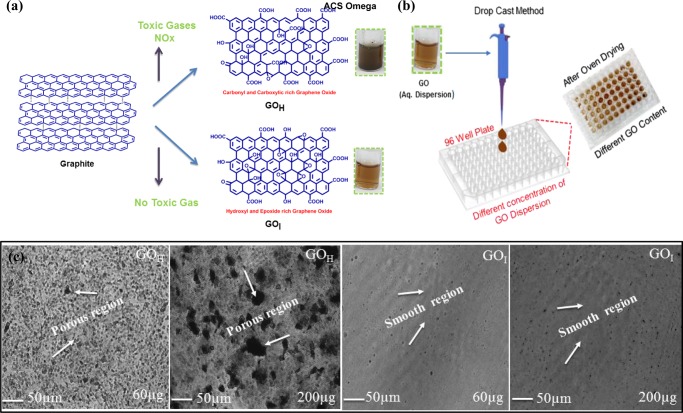
Figure 1.
Overview of the synthetic methodology for the preparation of GO and the fabrication process. (a) Left: Schematic showing the preparation of GO via the Hummers’ method and improved method. Inset shows the respective dispersions of GO at the same concentration (0.5 mg/mL). (b) Right: Drop-casting method of the GO aqueous dispersion onto a 96-well plate followed by slow air-oven drying to allow evaporation of water to form the GO-coated surface on the well plate. (c) Representative light microscopy images of the drop-casted GO-coated surface (GOH and GOI) at different solid contents. The black regions are the porous domains formed in the coated GO surface, and the gray area represents the GO nanosheets. At higher solid contents, the porosity of the GOH coating is much higher. The GOI surface showed a comparatively less porous surface. Scale bar = 50 μm.

