Figure 3.

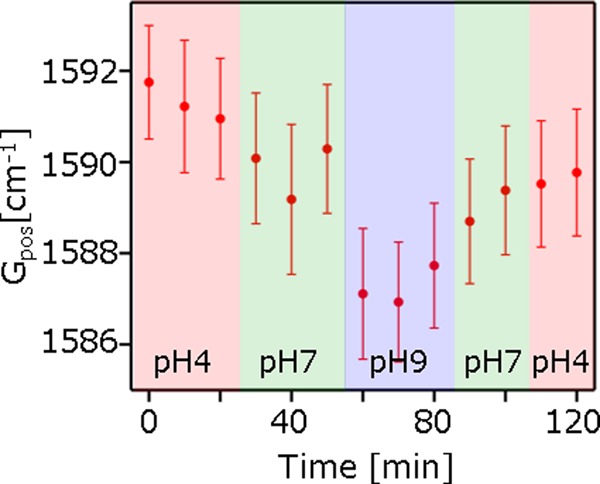
Transient response of Gpos against pH change. Each dot represents the average value from the Raman images in Figure S2. The error bar represents the standard deviation.

Transient response of Gpos against pH change. Each dot represents the average value from the Raman images in Figure S2. The error bar represents the standard deviation.