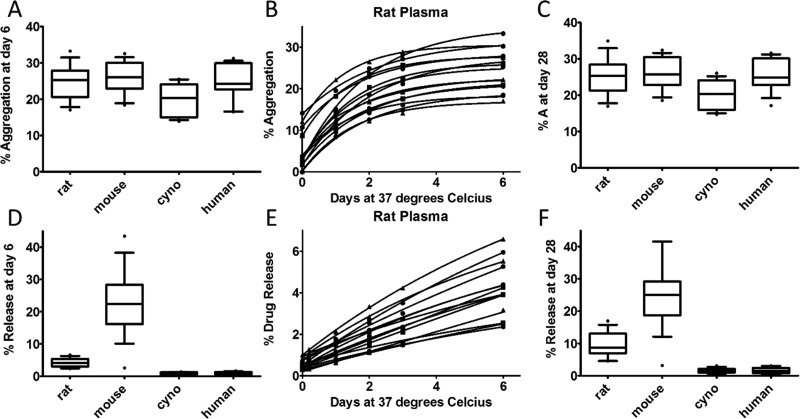
Figure 4.
Stability screening of 15 vc–MMAE containing ADCs in different plasma matrices. ADCs containing the same vc–MMAE payload were conjugated to different antibodies and assessed for both (top) aggregation and (bottom) release levels in parallel over 6 days. (A) A box and whisker plot shows the aggregation levels at day 6 for the ADCs in the four plasma matrices. The box covers the 25th through 75th percentile of data and the whiskers extend to the 10th and 90th percentiles. The line through the box is the median value. (B) Aggregation data from rat plasma was fit with eq 1. (C) The predicted level of aggregation at day 28 is represented with box and whisker plots. (D) Release data at day six is represented by a box and whisker plot. (E) The fit released drug data from rat plasma using eq 2 is graphed. (F) The predicted amount of release at day 28 is represented with box and whisker plots.

