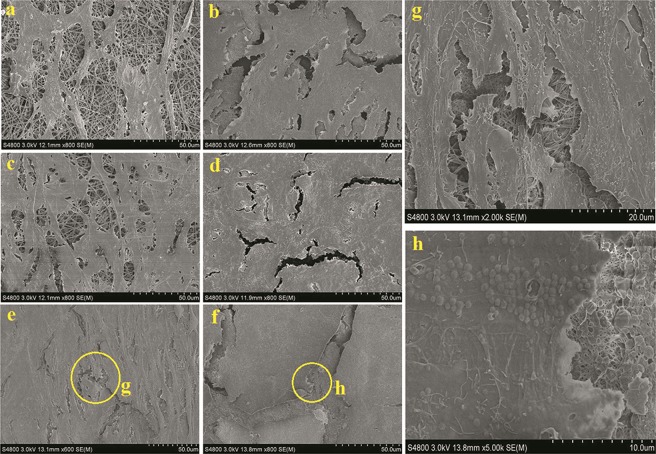
Figure 10.
SEM images of cells on the SF and SF/GO-blended nanofibers: (a, c, e) cells culture on SF after days 1, 3, and 7, respectively; (b, d, f) cells culture on SF/GO after days 1, 3, and 7, respectively, (g, h) high-resolution SEM images of the cells on SF and SF/GO-blended nanofibers after culturing for 7 days, respectively.

