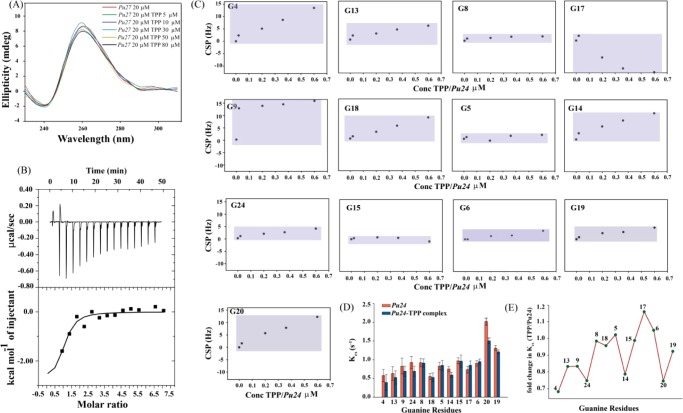
Figure 4.
(A) CD titrations of Pu27 with increasing concentration of TPP. (B) ITC profile generated from the titration of Pu27 with TPP. The upper panel represents the isothermal plot of the Pu27–TPP complex formation, whereas the bottom panel displays the integrated binding isotherm generated from the integration of peak area as a function of molar ratio. The solid line represents the best fit data using the “one-site binding model”. (C) Chemical shift perturbations of imino regions of Pu24 when titrated with increasing concentration of TPP. (D) Rate of hydrogen exchange of imino protons (Kex) of unbound-Pu24 and Pu24–TPP complex. (E) Fold change in Kex (TPP/Pu24).

