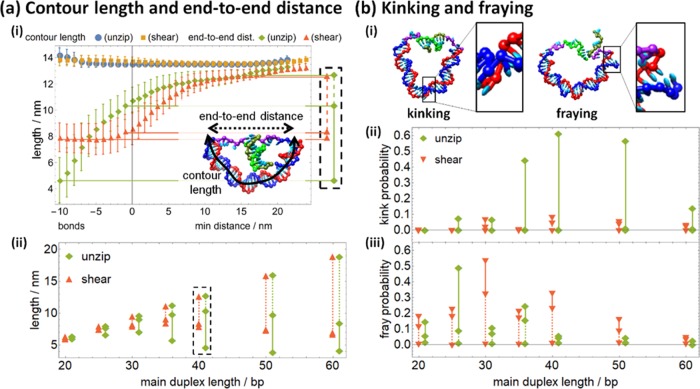
Figure 4.
(a) (i) As either shearing or unzipping proceeds (shown for main duplex length 40 bp), the end-to-end distance across the main duplex increases as it relaxes, whereas the contour length increases slightly at either high bond number or high min distance. (Here and in Figure 5, error bars are in-run fluctuations; the standard error of mean is the size of the symbols or smaller.) The inset shows how contour length (solid) and end-to-end distance (dashed) are calculated for a typical configuration. The end-to-end distance is extracted at 10 bonds, one bond, and the unbound energy minimum for subsequent analysis, with the cutout corresponding to the inset in graph (ii). Graph (ii) shows how the end-to-end length increases as shearing and unzipping proceed. (b) (i) The melting of base pairs in the main duplex results in either kinking or fraying. Graphs (ii) and (iii) show how kinking and fraying, respectively, decrease as shearing and unzipping proceed. In graphs (a) (ii), (b) (ii), and (b) (iii), solid lines show the relaxation from the 10-bond state to the one bond state and dashed lines show the subsequent relaxation to the fully relaxed unbound state; unzipping data points are shifted 1 bp right for clarity.

