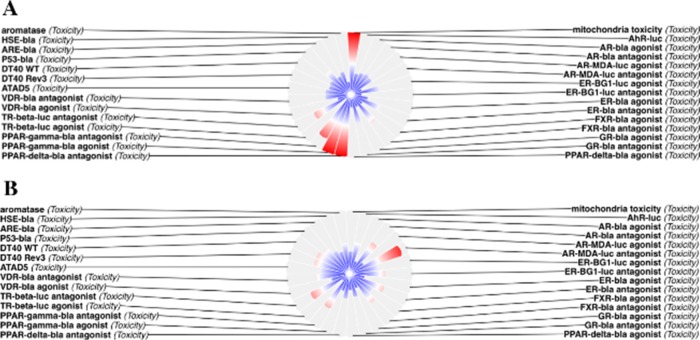
Figure 5.
Toxicity predictions for warfarin (A) and compound 2′ (B) using trained Bayesian models and sub-structure similarity search algorithm. Color-coded diagrams represent the signatures with low (blue), intermediate (white), or high toxic activity (red). The abbreviations of these three different biological assay systems are reported in Table 5.

