
Figure 6.
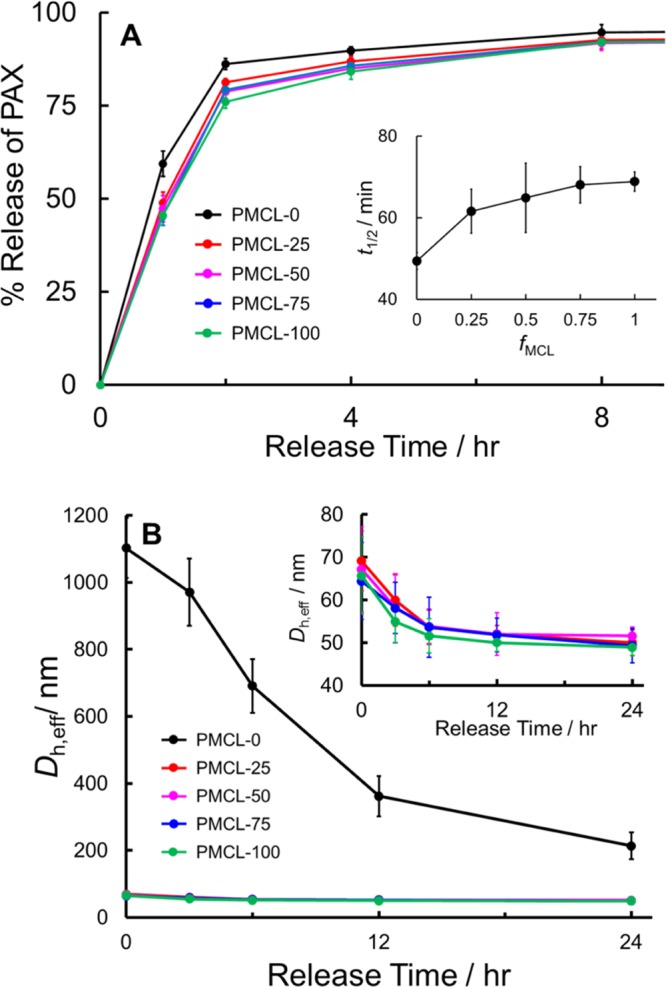
Effect of MCL content on in vitro PAX release. (A) In vitro PAX release profiles for bulk-prepared PAX-loaded PNPs with various MCL contents (r = 0.25) and corresponding plot of t1/2 vs fMCL (inset). (B) Dh,eff, vs release time for samples in (A), showing relative hydrolytic degradation rates during in vitro PAX release; inset shows re-scaled data for MCL-containing copolymers only.