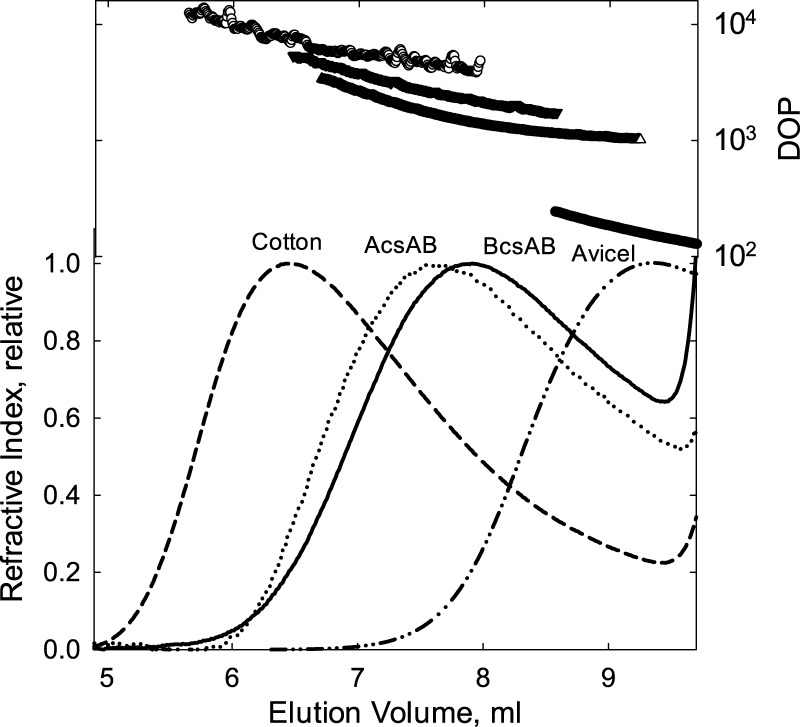
Figure 1.
GPC elution profiles of cellulose tricarbanilates. Cellulose samples (as labeled in the figure) were carbanilated, as described in Materials and Methods. For cellulose synthesized from BcsA-BcsB or AcsA-AcsB, 0.5 μM enzyme with 5 mM UDP-Glc in a reaction volume of 1.0 mL was used, as described in Materials and Methods. Reactions were allowed to proceed for 12 h. A KD-806M column was used with tetrahydrofuran as the mobile phase at a flow rate of 0.5 mL min–1. The figure shows the molecular weight distribution, converted to DOP on the right axis, above the associated refractive index detection signal.

