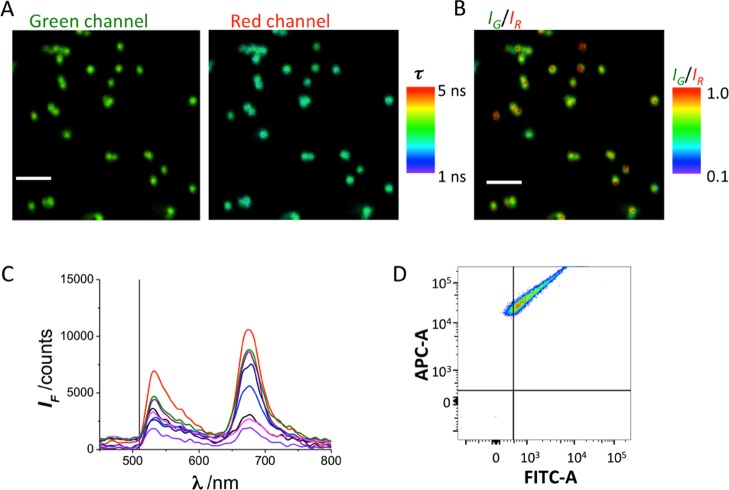
Figure 1.
(A) Dual-color FLIM images of Cy5-PEG-NP500 in the green and red emission channels. The pseudocolor scale indicates the average fluorescence lifetime of the emission in each pixel. The scale bar represents 2.5 μm. (B) IG/IR ratio image of the images shown in (A). The pseudocolor scale indicates the IG/IR value in each pixel. (C) Fluorescence emission spectra of different particles in the image. (D) FACS correlogram of detected fluorescence in the red (APC-A) and green (FITC-A) channels of Cy5-PEG-NP500 particles.

