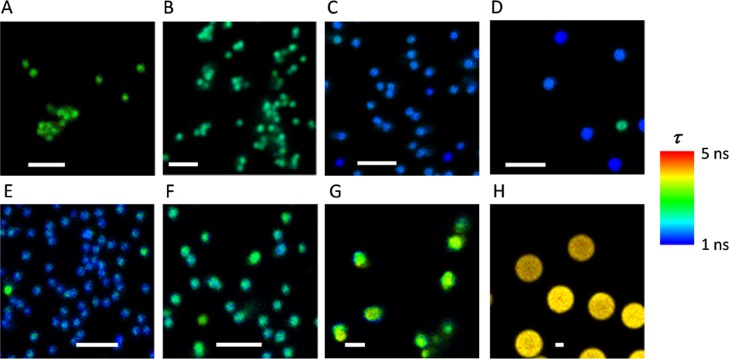
Figure 2.
FLIM images in the red emission channel of Cy5- and A647-loaded particles. The pseudocolor scale indicates the average fluorescence lifetime in each pixel. The scale bars represent 2.5 μm. (A) Cy5-PEG-NP500; (B) Cy5-PEG2-NP500; (C) Fmoc-Lys(Cy5)-NP900; (D) Strp-Lys(Cy5)-NP1200; (E) A647-PEG-NP500; (F) Fmoc-Lys(A647)-NP900; (G) Fmoc-Lys(A647)-NP2500; and (H) Fmoc-Lys(A647)-NP5000.

