
Figure 3.
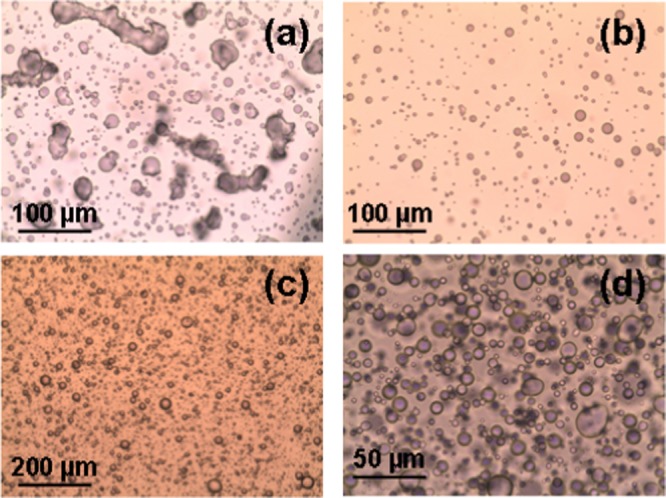
POM micrographs of bulk hydrated MO/EPA mixtures obtained at lipid ratios (a) MO/EPA 50:50 (mol/mol), (b) 30:70 (mol/mol), (c) 20:80 (mol/mol), and (d) 10:90 (mol/mol). The images are recorded at different magnifications using objectives 10× (image size: 880 × 660 μm2) (c), 20× (image size: 440 × 330 μm2) (b, c), and 40× (image size: 220 × 165 μm2) (d). The lipid/water ratio is 40:60 (w/w) in all bulk phase samples.