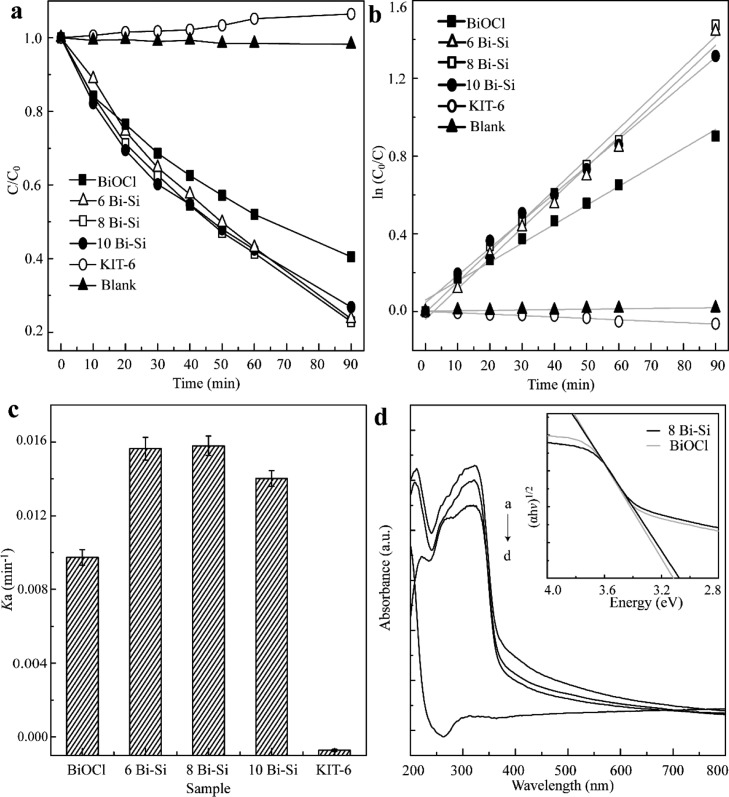
Figure 3.
(a) Photodegradation curves of variation in RhB concentration (C/C0) with UV light irradiation time over xBi–Si (x = 6, 8, and 10), BiOCl, KIT-6, and blank control. (b) Kinetic curves of ln(C0/C) vs time for RhB photodegradation over xBi–Si (x = 6, 8, and 10), BiOCl, KIT-6, and blank control. (c) Histograms of reaction rate constants (ka) of RhB over xBi–Si (x = 6, 8, and 10), BiOCl, and KIT-6 under UV light irradiation (λ ≤ 420 nm). (d) Ultraviolet–visible (UV–vis) diffuse reflectance spectra of the obtained materials ((i) 10Bi–Si; (ii) BiOCl; (iii) 8Bi–Si; and (iv) KIT-6) and (inset) plot of (αhν)1/2 vs photon energy for 8Bi–Si and BiOCl.

