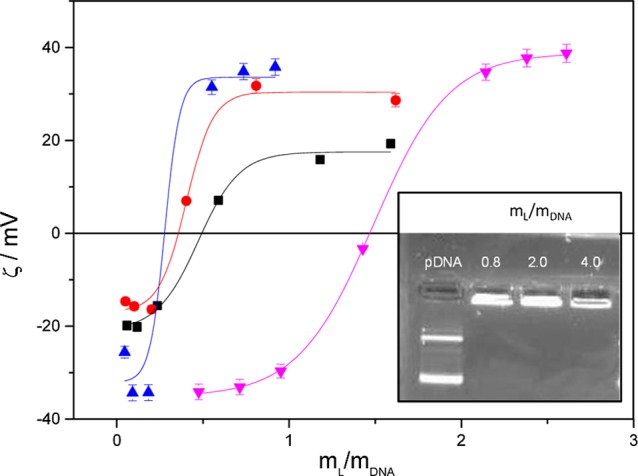
Figure 1.

Plot of zeta potential as a function of mL/mDNA mass ratio of the C6C22C6/DOPE–DNA lipoplexes, constituted by ctDNA at several molar compositions of the cationic lipid in the mixed lipids (α = 0.5, pink line) and with pDNA at α = 0.2, 0.5, and 0.7 (blue, red, and black lines), respectively. Inset: agarose gel electrophoresis of C6C22C6/DOPE–pDNA at several mL/mDNA mass ratios and α = 0.5. Free pDNA (lane 1) was used as the control.
