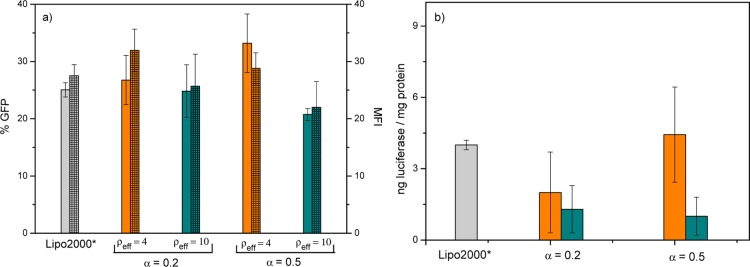
Figure 3.
TE levels of C6C22C6/DOPE–pDNA lipoplexes in COS-7 cells at two molar compositions of the cationic lipid in the mixed lipids (α = 0.2 and 0.5): (a) expressed as % GFP (solid bars) and MFI (squared bars) for plasmid pEGFP-C3 and (b) expressed as nanograms of luciferase per milligrams of protein for plasmid pCMV-Luc. The experiments were performed in the presence of 10% serum (FBS). The orange and green bars correspond to the effective charge ratios of ρeff = 4 and 10 in the lipoplex, respectively. The gray bar corresponds to Lipo2000*, used here as the positive control.

