
Figure 3.
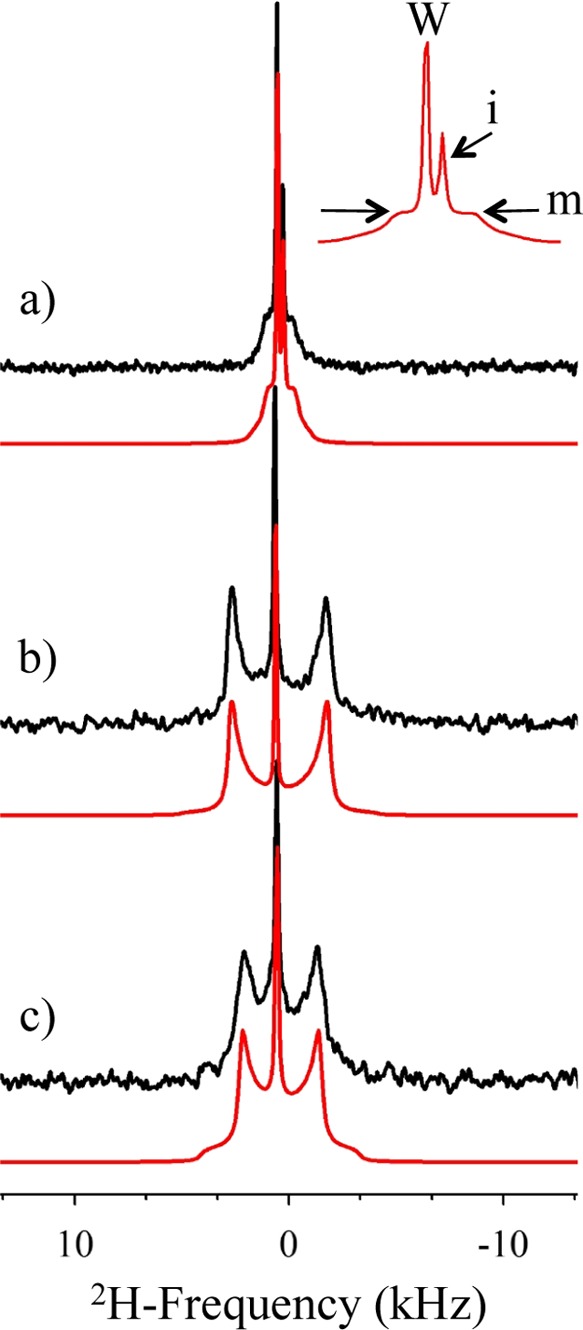
2H NMR spectra of deuterated OHM (a) in water (7.6 mM), (b) in POPC/SM/CHOL (10/60/30) at Ri = 15, and (c) in POPC at Ri = 15. Black traces stand for the experimental spectra, and red traces stand for the simulated ones. The top inset is the expansion of the simulation of (a), with W, i, and m representing water, isotropic, and micelle traces of OHM.