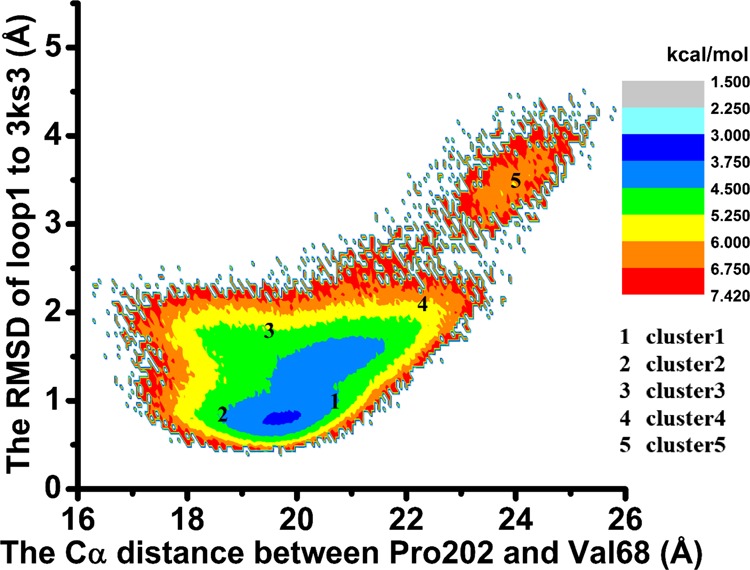
Figure 5.

Two-dimensional free energy for loop 1 from the MD simulations. The x axis represents the Cα distance between Pro202 and Val68, whereas the y axis represents the rmsd of loop 2 to the initial structure (PDB entry 3KS3). Points representative of the central conformations of the five clusters are also shown in the graphs.
