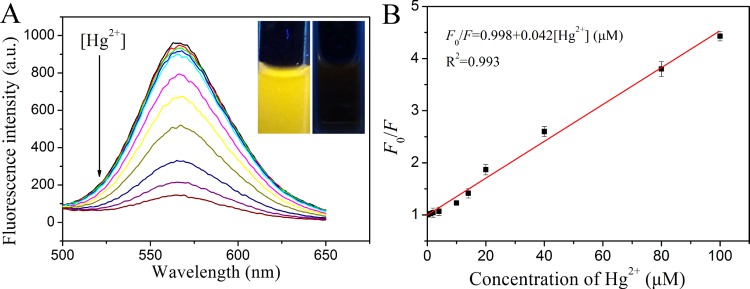
Figure 5.
(A) Fluorescence emission spectra of CuNCs upon addition of various concentrations of Hg2+. The insets show the photographs of CuNC solutions in the absence and presence of 100 μM Hg2+ under UV light (365 nm). (B) Relationship between F0/F and the concentration of Hg2+ in the range of 0.1–100 μM.

