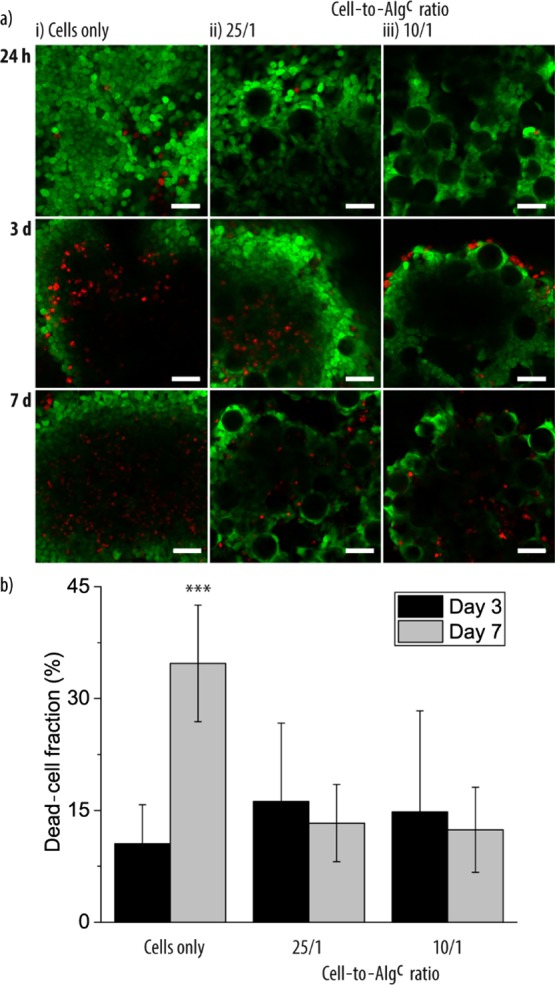
Figure 6.

(a) Representative CLSM images of stained live (green)—dead (red) cell aggregates assembled from HepG2 cells only (i) and HepG2 cells and Algc in a cell-to-particle ratio of 25/1 (ii) and 10/1 (iii). Images were taken after 24 h, 3 d, and 7 d. The scale bars are 50 μm. (b) Dead-cell fraction of the cell aggregates assembled from HepG2 cells only and HepG2 cells and Algc in cell-to-particle ratios of 25/1 and 10/1 calculated after 3 and 7 d (n = 3, ***p < 0.001).
