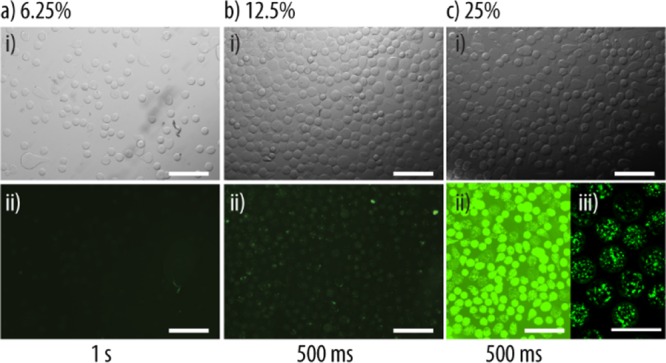
Figure 7.

Microreactor assembly: (a) representative bright-field (i) and fluorescence (ii) images of AlgLF using 6.25 (a), 12.5 (b), and 25 (c) v % LF for their assembly by D-μF. The exposure times of the fluorescence images are noted on the bottom to facilitate image comparison. The scale bars are 200 μm. (ciii) CLSM image of AlgLF. The scale bars are 100 μm.
