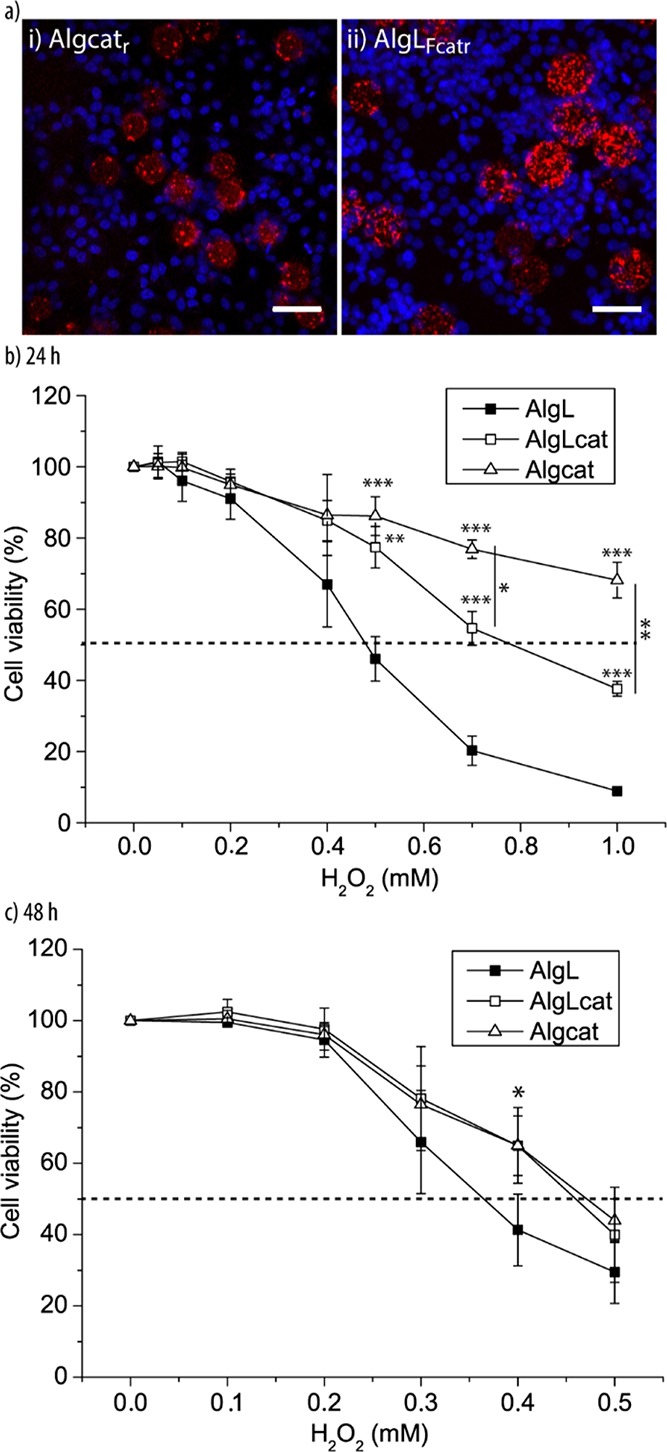
Figure 9.

Microreactors in planar cell cultures: (a) representative CLSM images of bionic tissue of HepG2 cells and Algcatr (i) and AlgLFcatr (ii) after 6 h incubation time. The scale bars are 50 μm. Dose–response curves of bionic tissue consisting of HepG2 cells and Algcat, AlgLcat, or AlgL when exposed to different concentrations of H2O2 for 24 h (b) and 48 h (c) (n = 3, ***p < 0.001, **p < 0.01, and *p < 0.05).
