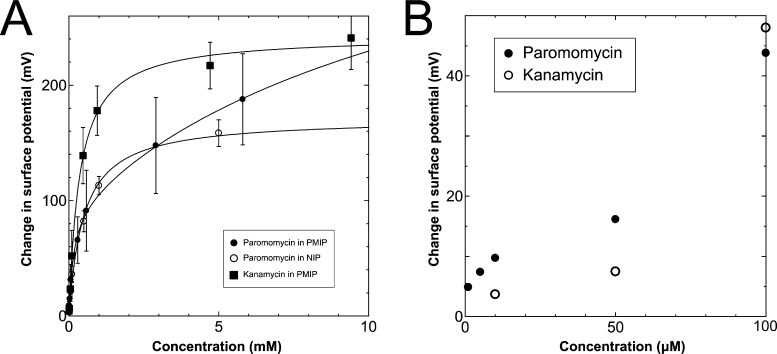
Figure 3.
(A) Change in surface potential as a function of target concentrations up to 10 mM. Calibration curves were determined by eqs 13 and 14. (Filled circle, open circle, and filled square show the addition of paromomycin into PMIP–FET, paromomycin into NIP–FET, and kanamycin into PMIP–FET, respectively.) (B) Comparison of the addition of paromomycin into PMIP–FET with that of kanamycin at low concentrations of less than 100 μM.

