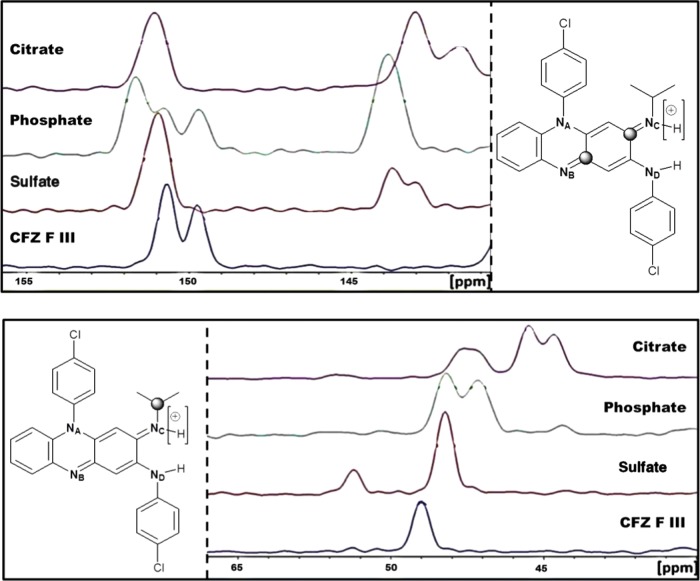
Figure 12.
Comparison of the 13C CPMAS spectra obtained for the citrate, phosphate, and sulfate salts with CFZ F III (top) in the range 140–155 ppm to monitor the chemical shift of the ketimine carbons highlighted and (bottom) in the range 40–65 ppm, to monitor the chemical shift of the isopropyl carbon highlighted.

