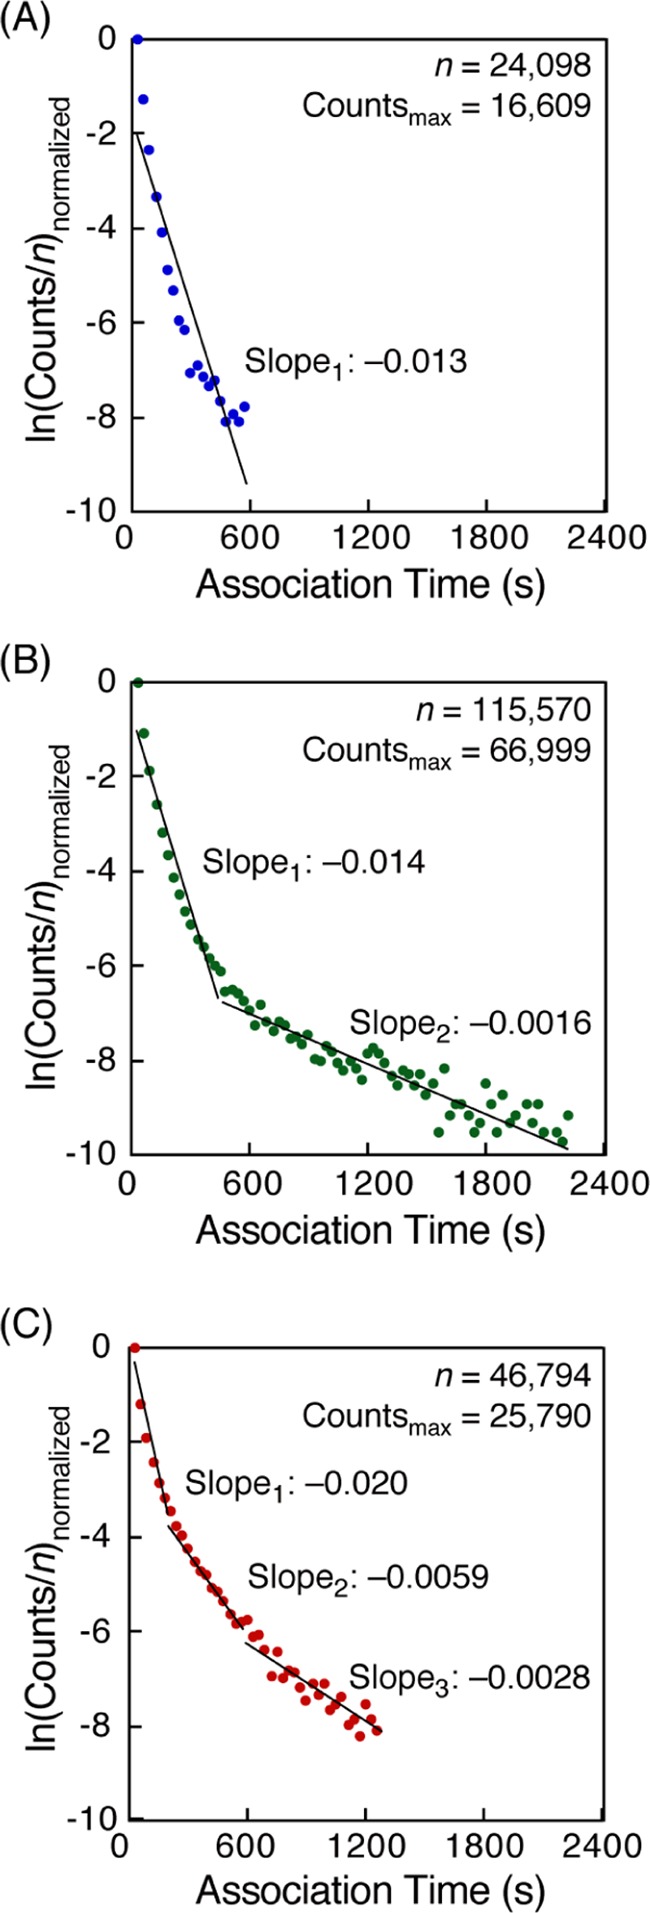
Figure 4.

Histogram analyses of association time for single-molecule hybridization of (A) 8 mer–8 mer, (B) 12 mer–12 mer, and (C) dA12–dT12 DNAs. Each vertical axis was normalized with the maximum value of (counts/n) of 1. Slope values were obtained according to eq 6 in Experimental Section. Time-lapse images were obtained at an interval of 30 s. Experimental conditions: 200 mM NaCl TE buffer (10 mM Tris–HCl, pH 8.0, 1 mM EDTA, 200 mM NaCl) [Cy3-DNA] = 1 nM at 20 °C.
