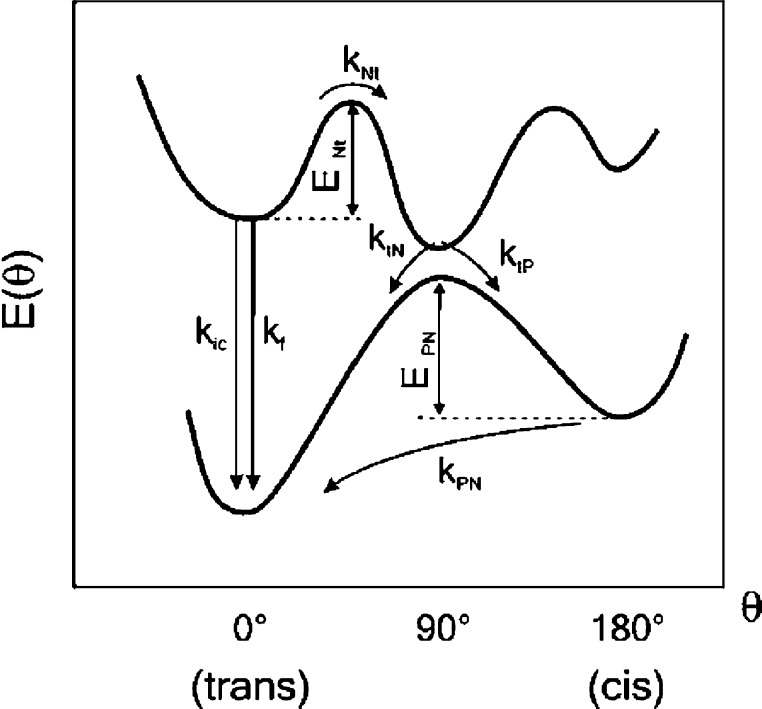
Figure 1.
Potential energy diagram for cyanine dye viscosity-induced fluorescence mechanism. The bottom and top curves represent the energies of the ground and first singlet excited states, respectively, as a function of the methane bridge torsion angle (Θ) (adapted from ref (19a)).

