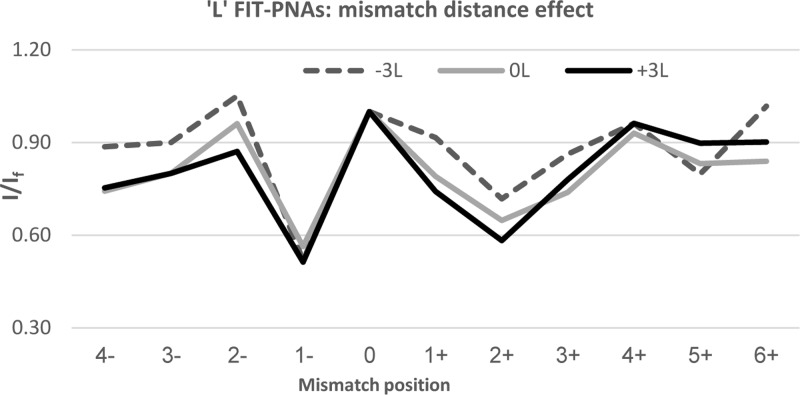
Figure 3.
Effect of shifting the mismatch from the adjacent sites (±1) to BisQ for the L FIT-PNA series. The negative values in the x-axis correlate with shifting the mismatch to the 5′-direction of BisQ, and positive values for a 3′ shift. The specific mismatches are detailed in Supporting Information Table S2.

