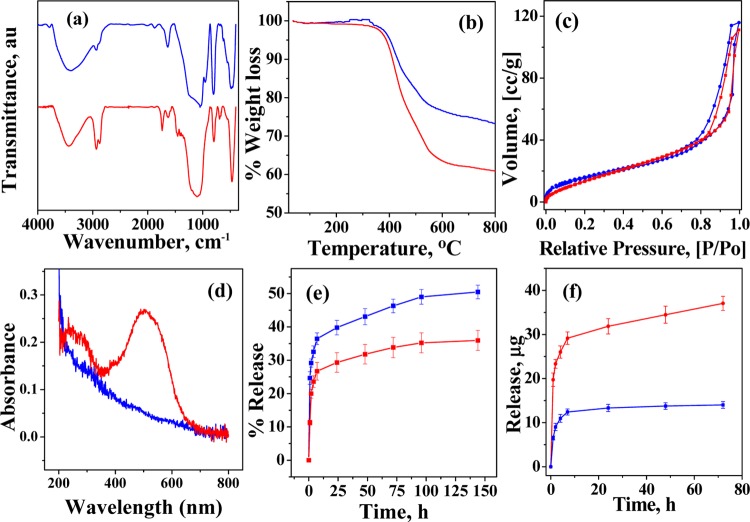
Figure 5.
(a) FT-IR spectra, (b) TGA curves, (c) N2 sorption isotherms, and (d) DRS–UV spectra. The color code for (a)–(d): MCM-allylCalix (Dox-free), blue and MCM-allylCalix-Dox (Dox-loaded), red. (e) Dox release profile for MCM-allylCalix-Dox in phosphate-buffered saline (PBS) buffer at pH 7.4 (red) and pH 5 (blue). (f) Dox release profile for MCM-allylCalix-Dox (red) and MCM-Dox (blue) in PBS buffer at pH 5.

