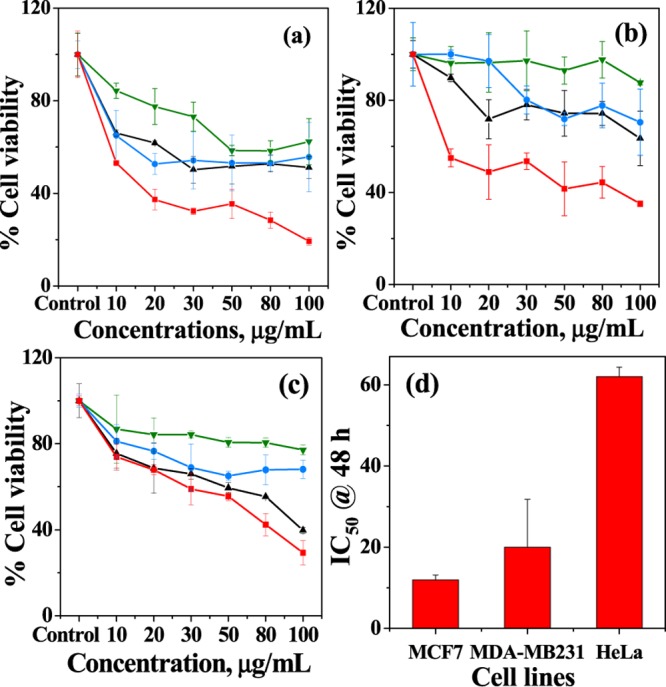
Figure 6.

Cell viability of MCM-allylCalix and MCM-allylCalix-Dox on (a) MCF7, (b) MDA-MB231, and (c) HeLa cells at 24 and 48 h incubation. Only cells (untreated) are used as control. Color codes: MCM-allylCalix_24 h, green; MCM-allylCalix-Dox_24 h, black; MCM-allylCalix_48 h, blue; MCM-allylCalix-Dox_48 h, red. (d) IC50 values (in μg/mL) of MCM-allylCalix-Dox for the same three cell lines. The results are presented as average percentages of the cell viability over three replicas.
