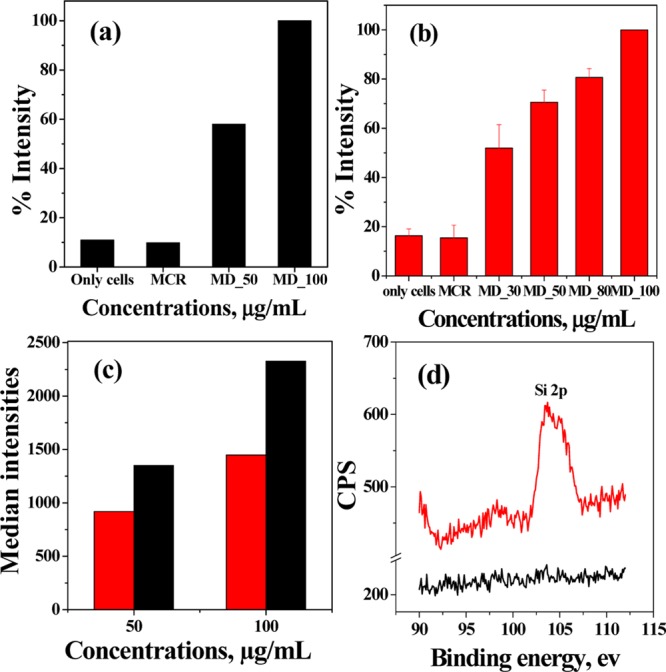
Figure 7.

Fluorescence intensities for (a) MCF7 and (b) HeLa cells obtained from FACS on treating with different concentrations of the Dox-loaded hybrid. “Only cells” refers to untreated cells, and these are used as control. MCR: MCM-allylCalix and MD: MCM-allylCalix-Dox. In “MD_X”, the “X” corresponds to the concentration in μg/mL. (c) Comparison of median intensities of HeLa (red) and MCF7 (black) cells. (d) XPS spectra of only HeLa cells (black) and HeLa cells treated with the silica–calix hybrid (red).
