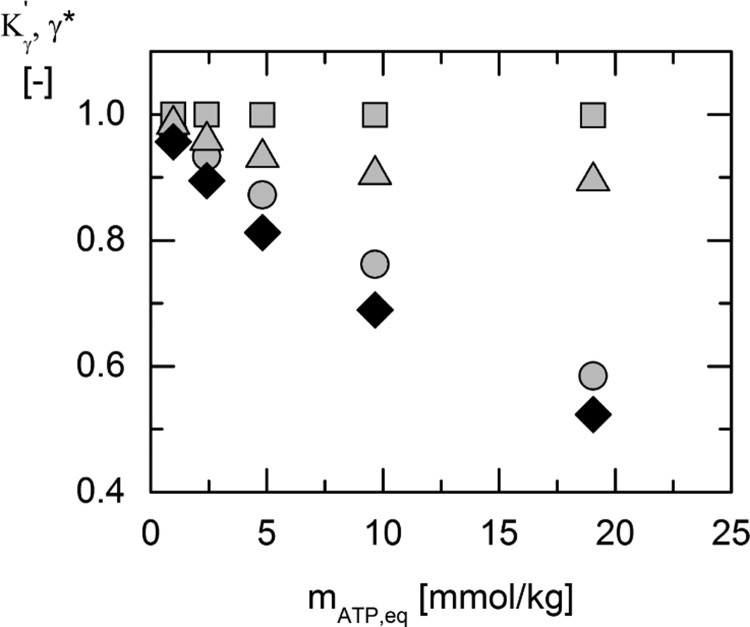
Figure 4.
ePC-SAFT predicted activity coefficients of ATP (circles), ADP (squares), 3-PG2– (triangles), and the resulting value of Kγ′ (black squares) vs the ATP molality mATP,eq at 313.15 K, resulting from the different initial substrate concentrations as listed in Table 5. Predictions in the multicomponent reaction mixtures were performed using the parameters from Tables 6 and 7.

