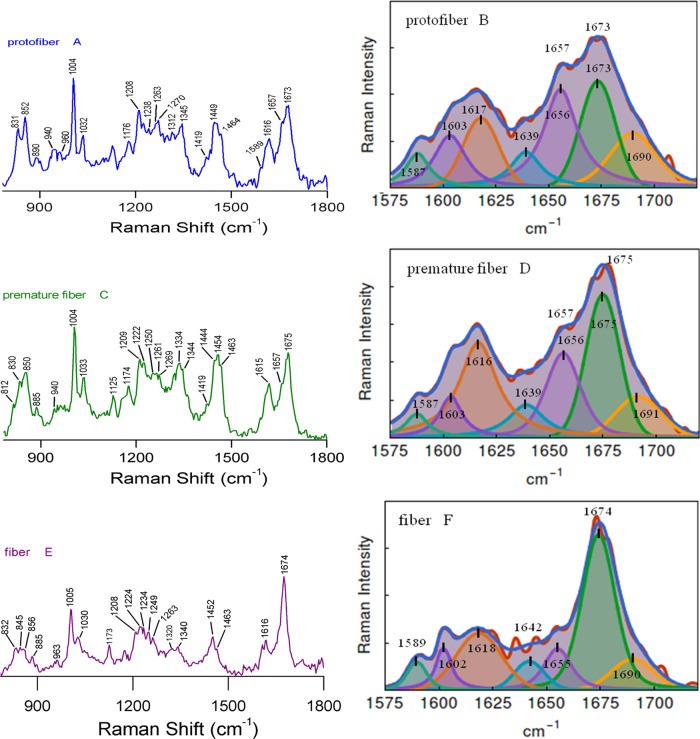
Figure 3.
Left panel shows the Raman spectra of insulin protofibril (A), premature fibril (C), and fibril (E) in the frequency range of 500–1800 cm–1. Respective panels (B, D and F) in the right present the curve-fitting analysis of extended amide I band of the Raman spectra. Other experimental and analysis conditions were same as that of Figure 2.

