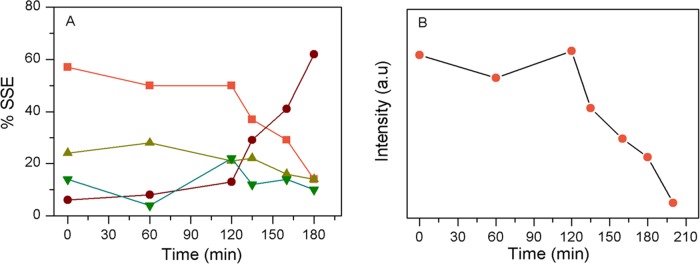
Figure 4.
Changes of different secondary structural contents of incubated insulin over time, as obtained from the curve-fitting analysis of Raman amide I band (Table 1). Panel (A) shows the changes in the secondary structural component (%) against incubation time: helix (orange), β-sheet (brown), loose β-strand, PPII and disordered (light green), and other undefined component (deep green). Panel (B) shows the changes in the Raman intensity of the special helical marker band at 940 cm–1 at different time points of incubation. The Raman intensity at 1449 cm–1 was used as a reference.

