Figure 5.

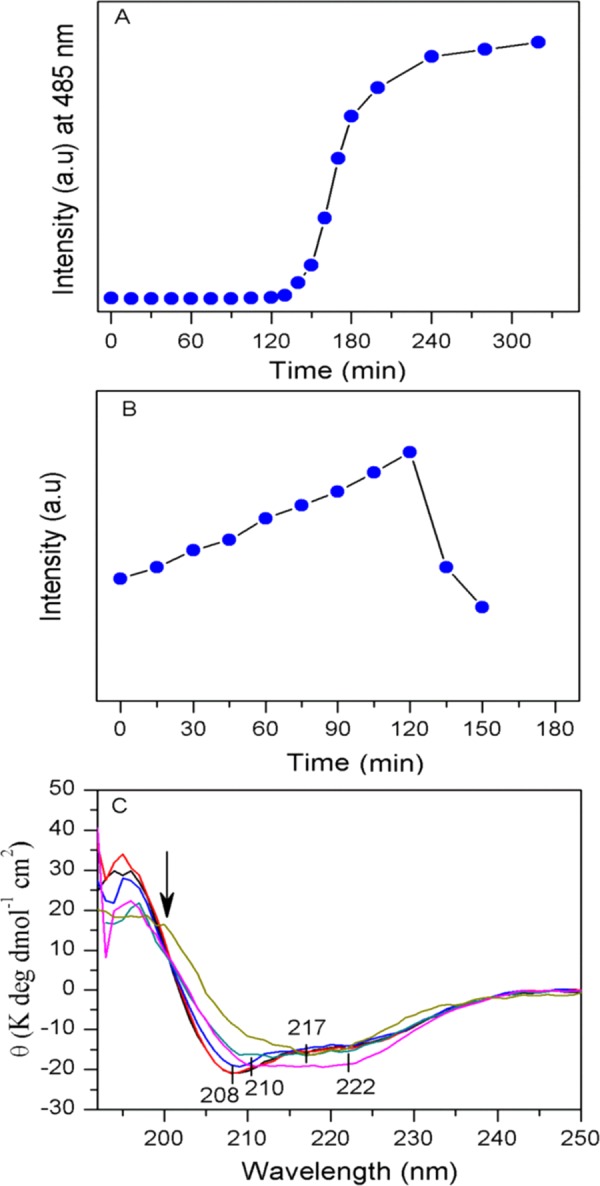
Kinetics of insulin amyloid formation, as monitored by ThT fluorescence assay, ANS binding study, and circular dichroism (CD) spectroscopic measurements of insulin solution incubated for aggregation. (A) ThT fluorescence assay. Each point indicates the ThT fluorescence intensity in the presence of a measured amount of incubated protein solution taken at the different time points of incubation. (B) Fluorescence of 1-anilino-8-naphthalene-sulfonate (ANS) in the presence of a fixed amount of the incubated sample taken at several time points of incubation and added to ANS solution. (C) Far-UV CD spectra of incubated insulin solution at different times: 0 min (black), 60 min (red), 120 min (blue), 135 min (cyan), 160 min (pink), and 180 min (yellow). Details are given in the Materials and Methods section, and the species type may be inferred from Figure 1.
