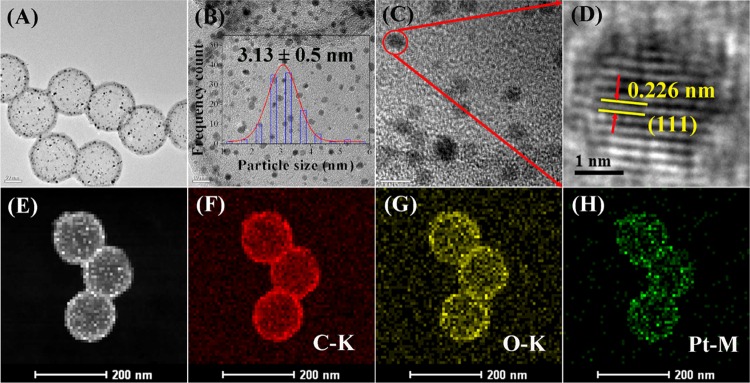
Figure 2.
(A–D) High-resolution TEM (HRTEM) images of Pt/HCS at different magnifications. Scanning transmission electron microscopy (STEM) image of Pt/HCS (E) and the corresponding element mappings of C (F), O (G), and Pt (H). The inset in B shows the size-distribution histogram of Pt nanoparticles in Pt/HCS.

